Monday, March 22, 2010

Berkshire Hathaway Safer than U.S. Treasuries

Via Bloomberg:

Two-year notes sold by [Warren Buffett's] Berkshire Hathaway Inc. in February yield 3.5 basis points less than Treasuries of similar maturity, according to data compiled by Bloomberg ...

While Treasuries backed by the full faith and credit of the government typically yield less than corporate debt, the relationship has flipped as Moody’s Investors Service predicts the U.S. will spend more on debt service as a percentage of revenue this year than any other top-rated country except the U.K. America will use about 7 percent of taxes for debt payments in 2010 and almost 11 percent in 2013, moving “substantially” closer to losing its AAA rating, Moody’s said last week.

For different reasons John Hussman doesn't like the market at this level:

The 2007 peak reflected rich valuation multiples against earnings that were themselves inflated by abnormally elevated profit margins. The anchoring of investor expectations to a period of rich valuations and unusually wide profit margins may not be reasonable, but it prevents any ability to “forecast” a significant near term decline, much less a sustained downtrend ... With the overvalued, overbought conditions of October now compounded by rising yield pressures and overbullish sentiment on a variety of measures (investment advisors are again down to just 21.3% bears), we remain defensively positioned here.

Monday, March 8, 2010

Top 5 Finance Paper Downloads

The top 5 recent finance paper downloads at SSRN — only papers announced in the last 60 days are eligible:

1. [902 downloads] Manufacturing Tail Risk: A Perspective on the Financial Crisis of 2007-09 by Viral V. Acharya, Thomas F. Cooley, Matthew P. Richardson and Ingo Walter (New York University)

2. [797 downloads] Economists' Hubris - The Case of Risk Management by Shahin Shojai (Capco) and George Feiger (Contango Capital Advisors)

3. [796 downloads] A Comparison of Quantitative and Qualitative Hedge Funds by Ludwig B. Chincarini (Pomona College)

4. [503 downloads] Market Timing & Trading Strategies Using Asset Rotation by Panagiotis Schizas and Dimitrios D. Thomakos (University of Peloponnese)

5. [479 downloads] My Life in Finance by Eugene F. Fama (University of Chicago)

Also, congratulations to Mebane Faber whose paper A Quantitative Approach to Tactical Asset Allocation has been downloaded 26161 times in the last 12 months, the most of any paper at SSRN and more than double the runner up.

Sunday, February 28, 2010

Asset allocation for March

In February U.S. Treasuries, as measured by the Ryan 10-year Treasury Index, once again crossed above their 10-month moving average, this time by the merest 0.41%. Commodities, as measured by the S&P GSCI Total Return index, did the same, albeit by a larger percentage.

Someday, when we are ambitious and with time on our hands, we will determine a percentage or other factor by which the moving average must be crossed before making a trade. For now, however, the model is fully invested as of Monday morning. Here are March's allocations:

  • U.S. stocks: 20%
  • Foreign stocks (EAFE): 20%
  • US Treasuries (10 year): 20%
  • Commodities: 20%
  • REITs: 20%

Sunday, January 31, 2010

Asset allocation for February

In December U.S. Treasuries, as measured by the Ryan 10-year Treasury Index, fell below their 10-month moving average. In January commodities, as measured by the S&P GSCI Index, did the same. U.S. stocks (S&P 500) are 7% off their highs, and foreign stocks (EAFE) are 8% off theirs. Another 7% and 5% respectively and we will sell those as well at the end of February.

Here are February's allocations:

  • U.S. stocks: 20%
  • Foreign stocks (EAFE): 20%
  • REITs: 20%
  • Cash: 40%

Tuesday, December 1, 2009

Asset allocation for December

The Faber timing model has moved into fully invested mode. U.S. Treasuries, as measured by the Ryan 10-year Treasury Index, crossed above their 10-month moving average last month, so the system is now in Treasuries, as well as all four of the other asset classes. Last month I suggested avoiding long-term bonds, on grounds of their clear overvaluation (if you believe serious inflation is on the way). Having had a month to reflect on that, I've decided to follow the system anyway. Really, you could justify not being in any of the asset classes based on their being overvalued (see Hussman this week for an especially gloomy view). If the current unpleasantness turns into a double-dip recession, Treasuries may well be the only one of the five asset classes with positive performance. They provide needed diversification to the portfolio.

Here are December's allocations:

  • U.S. stocks: 20%
  • Foreign stocks (EAFE): 20%
  • U.S. Treasuries: 20%
  • Commodities: 20%
  • REITs: 20%

Thursday, November 19, 2009

Favorable seasonality looking forward

Today is a good day to revisit the stock market seasonality chart. I've recentered it on January 1 to give a better view of the coming months. There is a modest local low on November 20, marked on the chart by the "You are here" sign. From there we see strong positive seasonality through the end of the year; then slower but still positive movement January through March, followed by strength in April and May.

The market didn't follow the seasonality script during the summer. There is no guarantee that it will do so this holiday season. This is just another datum in our collection, to be pondered and considered with all the others.

Wednesday, November 18, 2009

The next bubble, now in progress

Quote of the day (actually it's from September) from Pacific Research Institute economist Robert Murphy:

Why do we assume that TIPS traders are genius forecasters, but gold traders are morons?

Leading up to the money quote, Murphy says:

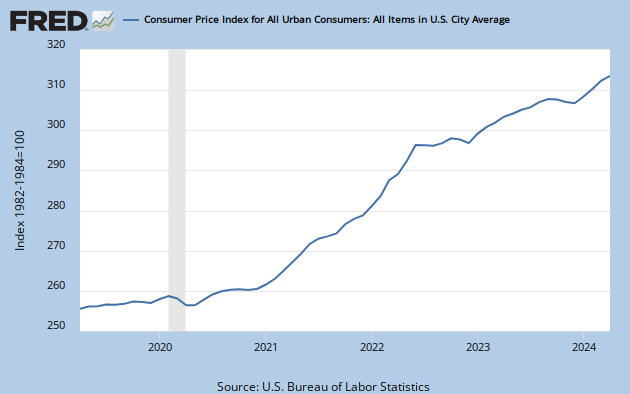
It is extremely misleading when the deflationists say, “What are you nutjobs talking about? Year/year we still have price drops!” Look at this chart of the raw (non-adjusted) CPI for the last five years. Now do you see why I think we are in an inflationary environment, even though the 12-month change in CPI is negative? For what it's worth, prices bottomed in Dec 08. From then until August 2009, the unadjusted CPI level has increased 2.7%, which translates to an annualized increase of just over 4%.

Via Veronique de Rugy:

In an email message, Murphy adds: “I believe we are currently witnessing a bubble in Treasury debt. I consider the current yields on 10-year U.S. government bonds to be absurdly low, just like the price of housing was absurdly high in early 2006. After this bubble bursts, investors will slap themselves on the forehead and say, ‘What were we thinking? Why did we rush into Treasurys even as the government told us it was planning to double the federal debt burden in a decade?’ ”