Sunday, January 31, 2010

Asset allocation for February

In December U.S. Treasuries, as measured by the Ryan 10-year Treasury Index, fell below their 10-month moving average. In January commodities, as measured by the S&P GSCI Index, did the same. U.S. stocks (S&P 500) are 7% off their highs, and foreign stocks (EAFE) are 8% off theirs. Another 7% and 5% respectively and we will sell those as well at the end of February.

Here are February's allocations:

  • U.S. stocks: 20%
  • Foreign stocks (EAFE): 20%
  • REITs: 20%
  • Cash: 40%

Tuesday, December 1, 2009

Asset allocation for December

The Faber timing model has moved into fully invested mode. U.S. Treasuries, as measured by the Ryan 10-year Treasury Index, crossed above their 10-month moving average last month, so the system is now in Treasuries, as well as all four of the other asset classes. Last month I suggested avoiding long-term bonds, on grounds of their clear overvaluation (if you believe serious inflation is on the way). Having had a month to reflect on that, I've decided to follow the system anyway. Really, you could justify not being in any of the asset classes based on their being overvalued (see Hussman this week for an especially gloomy view). If the current unpleasantness turns into a double-dip recession, Treasuries may well be the only one of the five asset classes with positive performance. They provide needed diversification to the portfolio.

Here are December's allocations:

  • U.S. stocks: 20%
  • Foreign stocks (EAFE): 20%
  • U.S. Treasuries: 20%
  • Commodities: 20%
  • REITs: 20%

Thursday, November 19, 2009

Favorable seasonality looking forward

Today is a good day to revisit the stock market seasonality chart. I've recentered it on January 1 to give a better view of the coming months. There is a modest local low on November 20, marked on the chart by the "You are here" sign. From there we see strong positive seasonality through the end of the year; then slower but still positive movement January through March, followed by strength in April and May.

The market didn't follow the seasonality script during the summer. There is no guarantee that it will do so this holiday season. This is just another datum in our collection, to be pondered and considered with all the others.

Wednesday, November 18, 2009

The next bubble, now in progress

Quote of the day (actually it's from September) from Pacific Research Institute economist Robert Murphy:

Why do we assume that TIPS traders are genius forecasters, but gold traders are morons?

Leading up to the money quote, Murphy says:

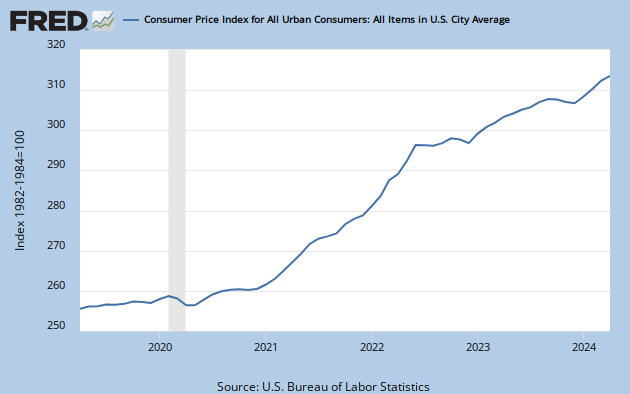
It is extremely misleading when the deflationists say, “What are you nutjobs talking about? Year/year we still have price drops!” Look at this chart of the raw (non-adjusted) CPI for the last five years. Now do you see why I think we are in an inflationary environment, even though the 12-month change in CPI is negative? For what it's worth, prices bottomed in Dec 08. From then until August 2009, the unadjusted CPI level has increased 2.7%, which translates to an annualized increase of just over 4%.

Via Veronique de Rugy:

In an email message, Murphy adds: “I believe we are currently witnessing a bubble in Treasury debt. I consider the current yields on 10-year U.S. government bonds to be absurdly low, just like the price of housing was absurdly high in early 2006. After this bubble bursts, investors will slap themselves on the forehead and say, ‘What were we thinking? Why did we rush into Treasurys even as the government told us it was planning to double the federal debt burden in a decade?’ ”

Tuesday, November 3, 2009

Asset allocation for November

The Faber timing model, by my calculations, has had no changes since August. U.S. Treasuries, as measured by the Ryan 10-year Treasury Index, came within 0.1% of a buy signal last Friday, but didn't quite make it. So we are still not in bonds. I know it's a bad idea to deviate from your system, but even if a buy signal had occurred this month, I would have stayed out. Looking 10 years ahead, there is no way a dollar will still be worth a dollar. Everyone buying long-term bonds today thinks they will be able to sell ahead of the crowd when the time comes. If the decline is gradual, they will be right. If not, not.

Mr. Faber in his paper uses bond data from Global Financial Data, but if that source is available free on the web, I haven't found it. The Ryan indexes are available both in the Wall Street Journal and on the Ryan web site (you will need to create a free login).

The last change in allocation was in August, after commodities (GSCI) and REITs (NAREIT [pdf]) crossed above their 10-month moving averages.

Here are November's allocations:

  • U.S. stocks: 20%
  • International stocks (EAFE): 20%
  • Commodities: 20%
  • REITs: 20%
  • Cash: 20%

Thursday, August 13, 2009

What we were reading one year ago

Morningstar Blogs, 10 August 2008*, reports Jeremy Siegel's views.

The call got off to a quick start, as Siegel opened with a bold prediction, effectively stating that we've seen the market bottom (particularly in financials). In his view, the market reached a "selling climax" on July 15--the day he thinks will be noted as the low point of this cycle. Referencing what many believed to be signs of a "bottom" in mid-March with the whole Bear Stearns debacle, Siegel made what seems to be a very dangerous claim (given the high-level of uncertainty in the markets): "this time around will be different."

... To support his views, Siegel also took a jab at market pessimists who claim that the stock market hardly looks cheap with a P/E on the S&P 500 index's trailing 12 month earnings in the range of 22 to 23 times. Siegel argued that the huge write-downs from financial firms (and General Motors GM, for that matter) have caused a "valuation gap" to open up, and that if you look at operating earnings, you'd see a much different picture--and a P/E closer to 17. He also referenced the past few market bottoms, noting that the trailing 12 month P/E ratios on the reported earnings for the S&P 500 at each of those market bottoms was significantly higher than what we're seeing today. Simply put, he doesn't believe the market is justified in assuming "trough level" earnings on a going forward basis.

Being wrong comes with the territory in this business. "Predictions can be very difficult—especially about the future." —Neils Bohr, although occasionally attributed to these guys.

John Hussman, 11 August 2008, likens himself to a "nervous bunny."

With bonds and utilities deteriorating, stock market internals are becoming unusually hostile. This sort of joint deterioration in interest sensitive securities has often provided important warning of steep subsequent losses, as we observed for example in 1966, 1987, and 1990. While the market is still sustaining something of a relief rally from the lows of a few weeks ago, I've noted that hostile yield trends have a tendency to cut such advances short, even when bearish sentiment and oversold conditions would otherwise invite more sustained bear market rallies.

Paul Tudor Jones, in Alpha magazine, via Harry Newton.

I see the younger generation hampered by the need to understand and rationalize why something should go up or down. Usually, by the time that becomes self-evident, the move is already over. When I got into the business, there was so little information on fundamentals, and what little information one could get was largely imperfect. We learned just to go with the chart. Why work when Mr. Market can do it for you? These days, there are many more deep intellectuals in the business, and that, coupled with the explosion of information on the Internet, creates the illusion that there is an explanation for everything and that the primary task is simply to find that explanation. As a result, technical analysis is at the bottom of the study list for many of the younger generation, particularly since the skill often requires them to close their eyes and trust the price action. The pain of gain is just too overwhelming for all of us to bear!

Today there are young men and women graduating from college who have a tremendous work ethic, but they get lost trying to understand the logic behind a whole variety of market moves. While I’m a staunch advocate of higher education, there is no training — classroom or otherwise — that can prepare for trading the last third of a move, whether it’s the end of a bull market or the end of a bear market. There’s typically no logic to it; irrationality reigns supreme, and no class can teach what to do during that brief, volatile reign. The only way to learn how to trade during that last, exquisite third of a move is to do it, or, more precisely, live it — a sort of baptism by fire. One has to experience both the elation and fear as markets move five and six standard deviations from conventional definitions of value.
"Irrationality reigns supreme." He wasn't talking about 2009, but he could have been.

*Footnote: That's when I read it, despite the archive now showing a date of 18 August. There's a story in there somewhere.

Tuesday, August 11, 2009

Mr. Market liked beaten-down stocks in July

This chart divides the universe of the 3000 largest cap U.S. stocks (minus a few that haven't been around for two years) into deciles by their two year total return from July 2007 through June 2009. Stocks that did poorly are to the left, stocks that did well are to the right. The stocks that did best during July are those that did worst during the prior two years.

The relationship is so smooth it's almost hard to believe. But then, if we drill down to the individual stocks, as the scatterplot below shows, the underlying reality is somewhat less orderly.

What stocks are those way to the left that lost 99% of their value over the last two years but still have enough market cap to be in the top 3000? Fannie Mae (FNM), Freddie Mac (FRE) and Ambac Financial Group (ABK).